Step On, Get Real, and Nerd Out


My fitness journey? Well, that wasn’t really a journey at first. Honestly, it started with a pretty humble goal: I just wanted to stop feeling horrified every time I glanced in the mirror. Next thing I know, I’m diving headfirst into muscle anatomy—because apparently, I’m one of those people who goes down glorious rabbit holes when the subject is ripe for nerding out.
Amy, saint/trainer extraordinaire, said "Get yourself a body composition scan." I'd heard of the DEXA (dual-energy x-ray absorptiometry) scan from a friend in California – the scanners were everywhere there - all the fitness rage. Circa 2023 in Massachusetts, it was more a curiosity mostly used for bone density checks and way pricier than on the West Coast. Enter the YMCA: not as fancy as DEXA, but better than a bathroom scale. And for our card-carrying Y members - free!
Our Y went for the basic InBody 270 scanner - which does't give all the nitty-gritty of other models, but way more than just body weight. The scanner uses bioelectrical impedance analysis (BIA) technology by sending very low-level electrical currents (microamps to milliamps) through the body and measuring how much your body resists the current. Muscle and water allow the current to flow easily, while fat resists it more. Using this impedance information, the scan estimates your body water, muscle, and fat in different parts of the body including your limbs and trunk. Is it totally accurate - nah. But it's miles better than your scale at home and great to track your progress over time. You just hop on, grip the arms, and 30 seconds later, voilà, your results printed out!
Then the real fun (read: confusion) began. I started obsessively figuring out what all that output meant. So, buckle up!
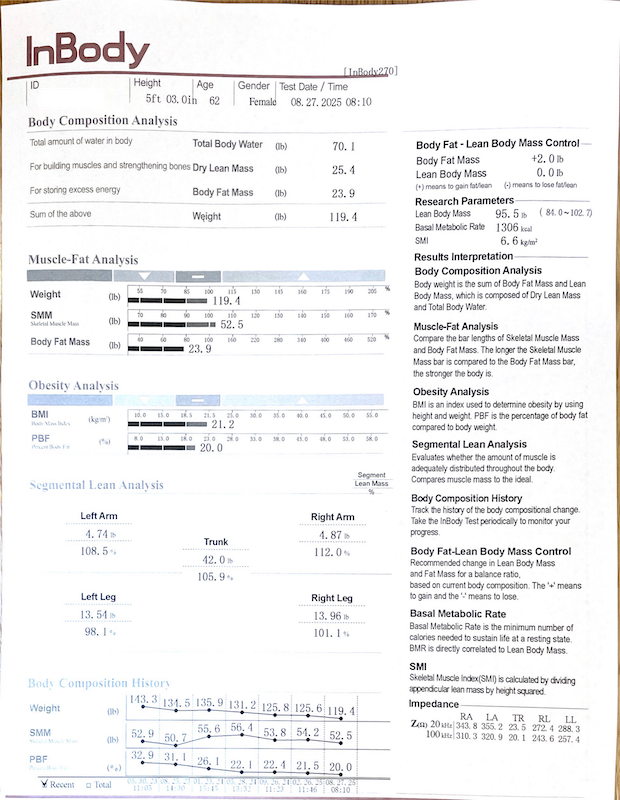
Muscle-Fat Analysis
This tells you your Skeletal Muscle Mass (the muscle you can actually build) and Body Fat Mass (all your fat, subcutaneous an visceral). The basic scanner lumps the 2 types of fat together – knowing how much subcutaneous (surface) and visceral (internal) is useful, but what do you want for free? You need some fat, but you want to have less of it than your Skeletal Muscle Mass. The Muscle-Fat Analysis provides this information in lbs. of muscle and body fat, and the Obesity Anayis provides the Percent Body Fat – I'll get to that in a moment.
My Muscle-Fat Analysis journeyed from a C-curve to a D-curve. The C-curve is seen by the endpoints of the bar chart where the weight and Body Fat Mass are longer than the Skeletal Muscle Mass - it is the "needs improvement" category (see Left side below from 2023). The D-shaped is where the Weight and Body Fat Mass bars are shorter than the Skeletal Muscle Mass and is considered an "athletic" body type. There’s an I-curve in between, with all bars balanced. Some folks stop there and call it good—they’re often healthy, but might still carry too much fat. Getting to I means you’re ready to prioritize muscle-building
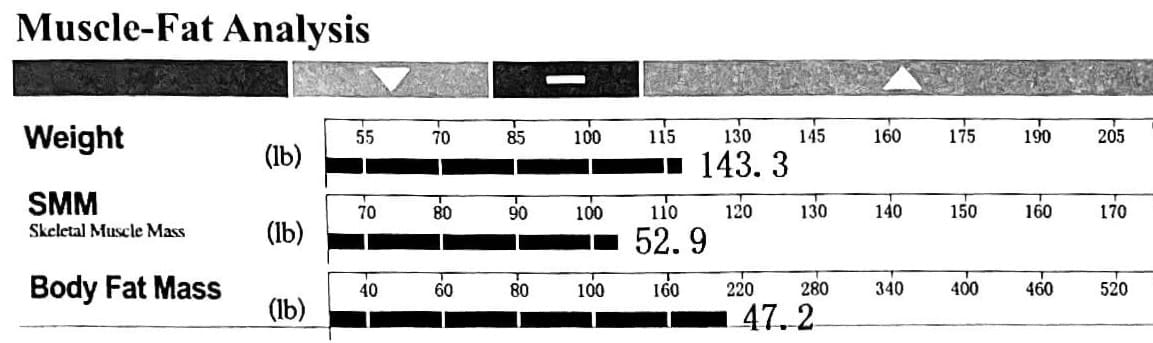
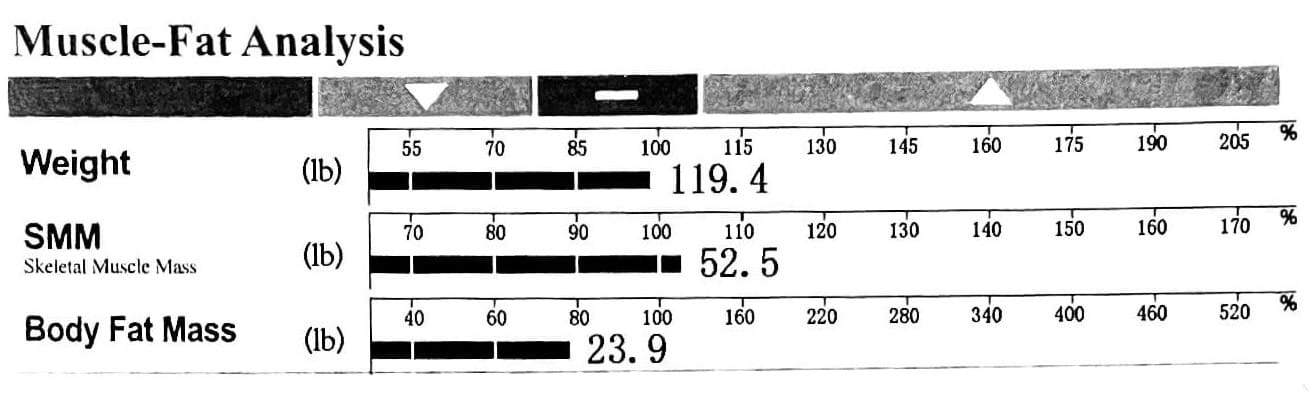
Left, 5/30/2023 -- Right, 8/27/2025
Between 2023 and now, my curve got better, but my muscle number barely budged—I mostly focused on losing weight, less on gaining muscle. The public health chatter loves weight and fat loss (important, for sure) but building muscle? That’s a newer conversation—one I’ll dive into in another post. Muscle gain can send the scale up even as fat drops—a confusing but welcome paradox. Protein intake matters here: muscles are mainly protein, and if you’re not eating enough, your muscles lose out. Imagine trying to fill a bucket with a hole in it. Oh, and as we age, muscle loss happens naturally, so keeping fit is a must.
Obesity Analysis
This section shows BMI and Percent Body Fat (PBF). BMI’s an oldie—weight divided by height squared—that doesn’t capture fat versus muscle. It’s more for population-level studies than individual insights. The scan gives both so you can compare. For me, BMI and PBF are close since I’m not overly muscular. My 20% body fat puts me at high fat levels for female athletes—but hey, that’s still pretty good considering where I started.
Segmental Lean Analysis
Now this part fascinated me. It breaks down Lean Body Mass (water, muscle, bones, organs) by arms, trunk, and legs. You want 100% or more in each segment—meaning your lean mass is on point for your body specs. My numbers have barely shifted in two years (a smidge in my legs), showing that concentrating on weight loss alone while strength training doesn’t equal muscle gain. My right side is stronger than my left (thanks, right-handedness), so I’ve got work to do on the left—especially the trunk/core and legs.
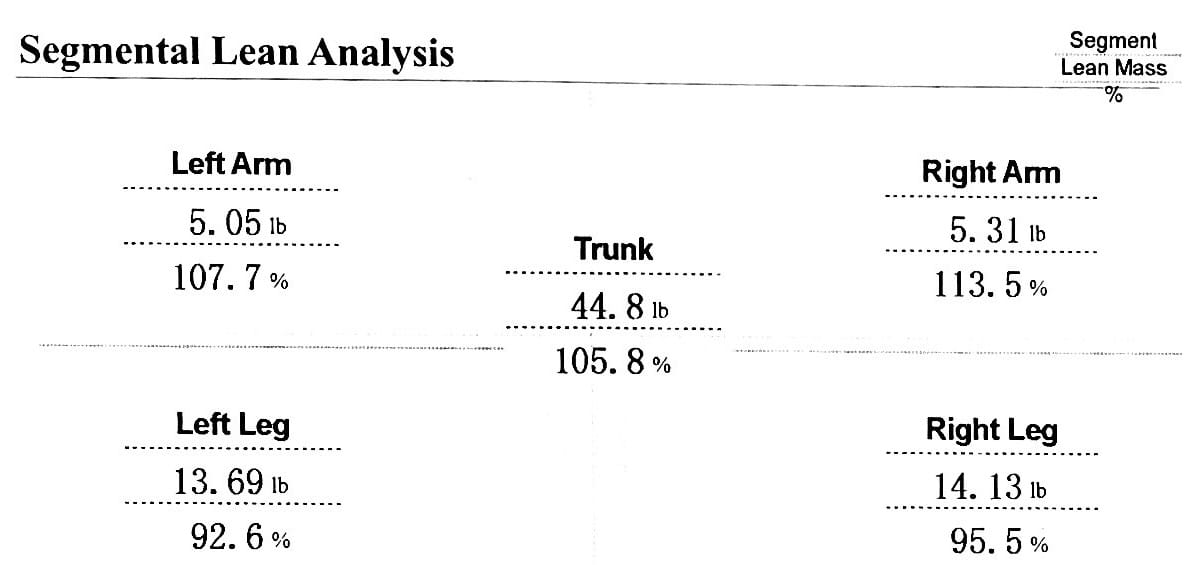
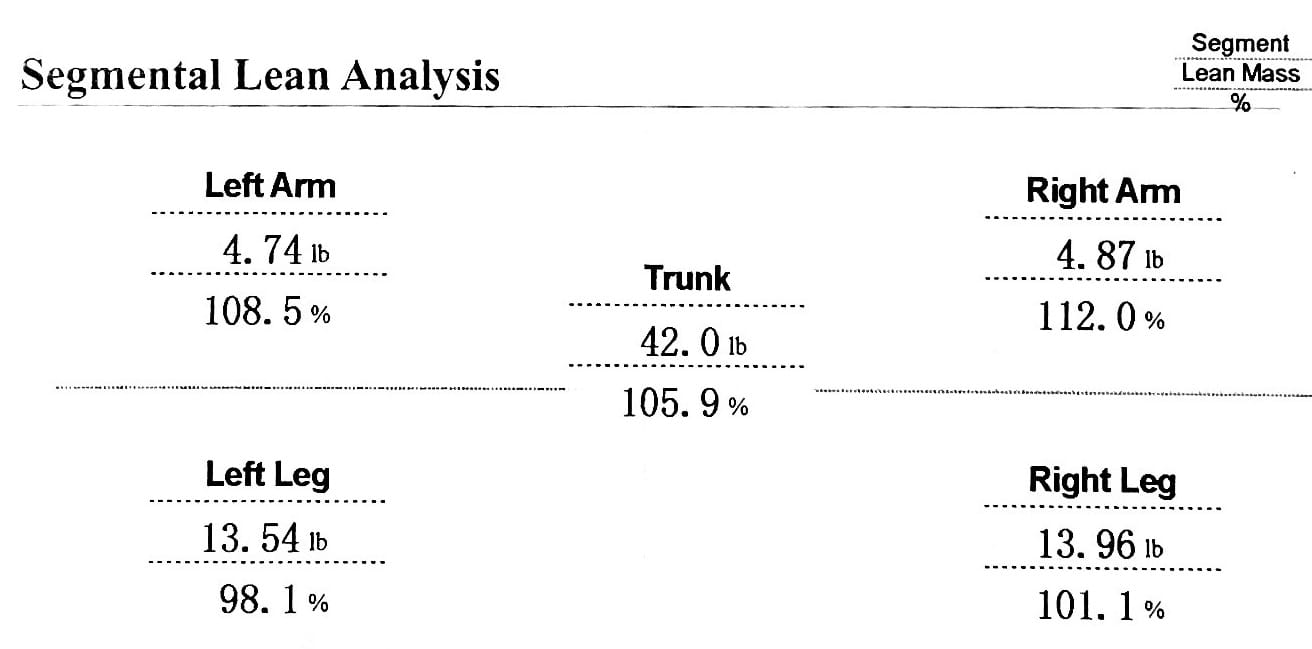
Left, 5/30/2023 -- Right, 8/27/2023
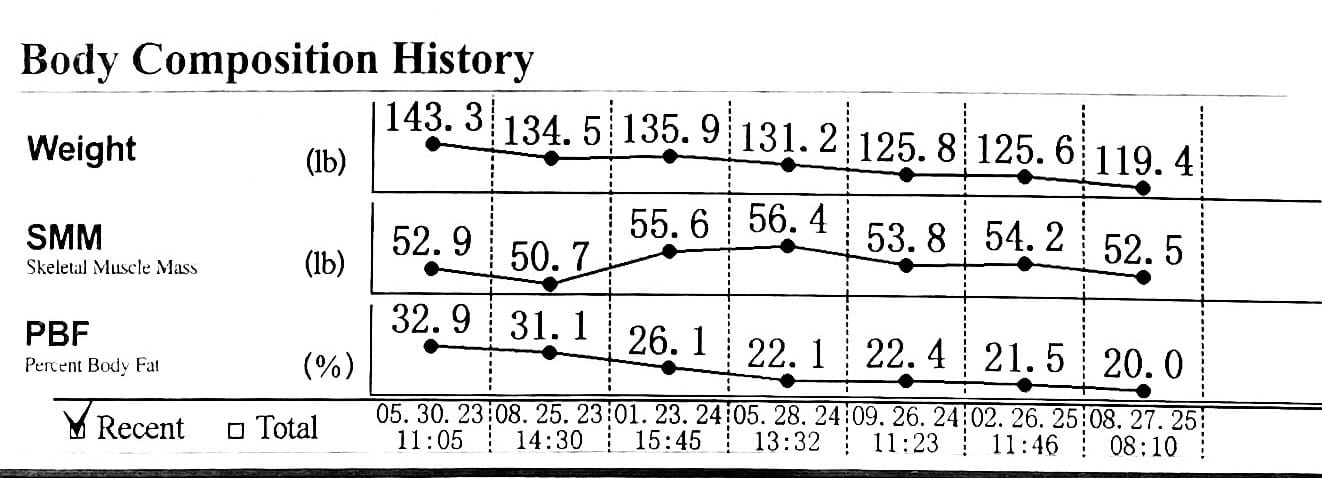
Body Composition History
Looking at the timelines, I clearly shed weight and fat, but muscle gains are elusive. Early on, I saw some muscle progress before shifting focus to weight loss.
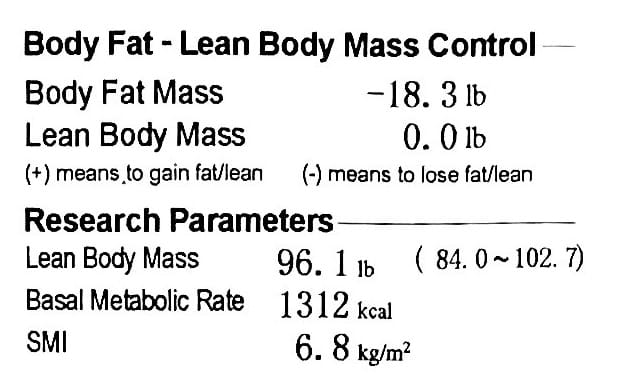
Right Column
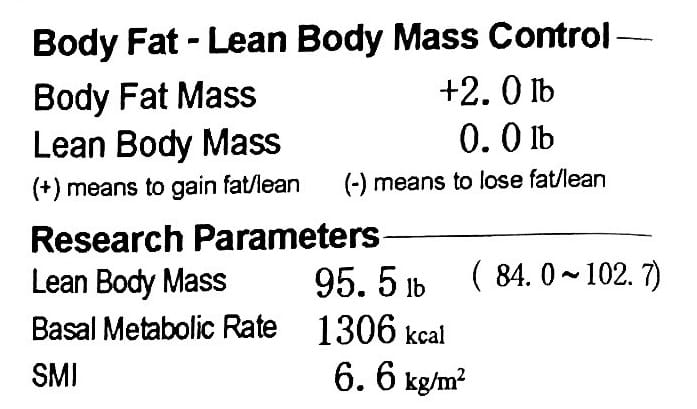
Here’s where the scan nudges you to balance fat and muscle goals. In 2023, it said lose 18.3 lbs of fat; now, it tells me to gain 2 lbs—progress! It won’t ever suggest dropping Lean Body Mass, but it might encourage building it. In my case, it has never recommended I gain Lean Body Mass – that's just me wanting to do that.
Left, 5/30/2023 -- Right, 8/27/2025
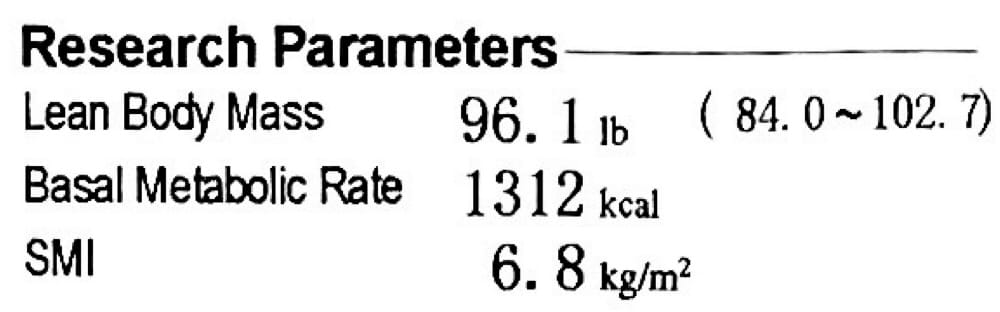
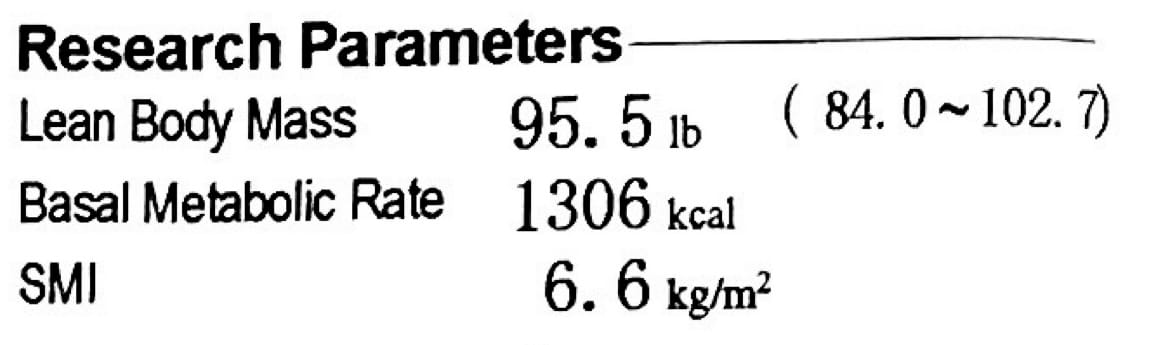
Basal Metabolic Rate (BMR – minimum calories of food energy your body needs to sustain life at a resting state) will rise with muscle gains (Lean Body Mass) and drop with losses—more muscle, more calories required. Skeletal Muscle Index (SMI) helps spot muscle depletion risks. General lower thresholds for sarcopenia are Men<6.35 kg/m2 and Women<5.03 kg/m2. My SMI bounced around but stays good, reminding me to keep chasing those muscles.
Left, 5/30/2023 -- Right, 8/27/2025
Bottom Line
Weight is just a number, but body composition tells a richer story. Scans guide, not judge. Track your fat and muscle, and watch a new you unfold. Go on, get a scan—become the lead character in your own data-driven drama.
Epilogue (because, why not?)
The scan’s jargon nearly crushed me, so here’s the cheat sheet:
Weight = should be close to your bathroom scale = Body Fat Mass + Lean Body Mass
Body Fat Mass = all fat, surface level (subcutaneous) and internal (visceral) fat
Lean Body Mass = water, muscle, bones, and organs = Total Body Water + Dry Lean Mass
Dry Lean Mass = muscle, bones, and organs = Proteins + Minerals = Lean Body Mass - Total Body Water. Some advanced scanners will separate protein and mineral measurements. Protein accounts for most of your muscle mass while minerals primarily reflect bone content. Elements such as calcium phosphate and magnesium give bones their hardness, strength, and rigidity.
Skeletal Muscle Mass - these are the muscles that can be grow through exercise. SMM is a subset of Dry Lean Mass as Dry Lean Mass also includes your bones and organs.
Sources: